Investigate An Endpoint
Use this walkthrough when you already know the shell basics and need a realistic endpoint investigation path: narrow the inventory, open the detail page, review static context, and decide whether to continue into a live session.
Outcome
Section titled “Outcome”By the end, you will know how to move from the endpoint list into the detail and session views that answer most first-look investigation questions.
Starting Context
Section titled “Starting Context”- You are signed in.
- At least one endpoint is visible on the
Endpointspage. - You know one searchable detail, such as hostname, computer ID, operating system, owner, or ticket context.
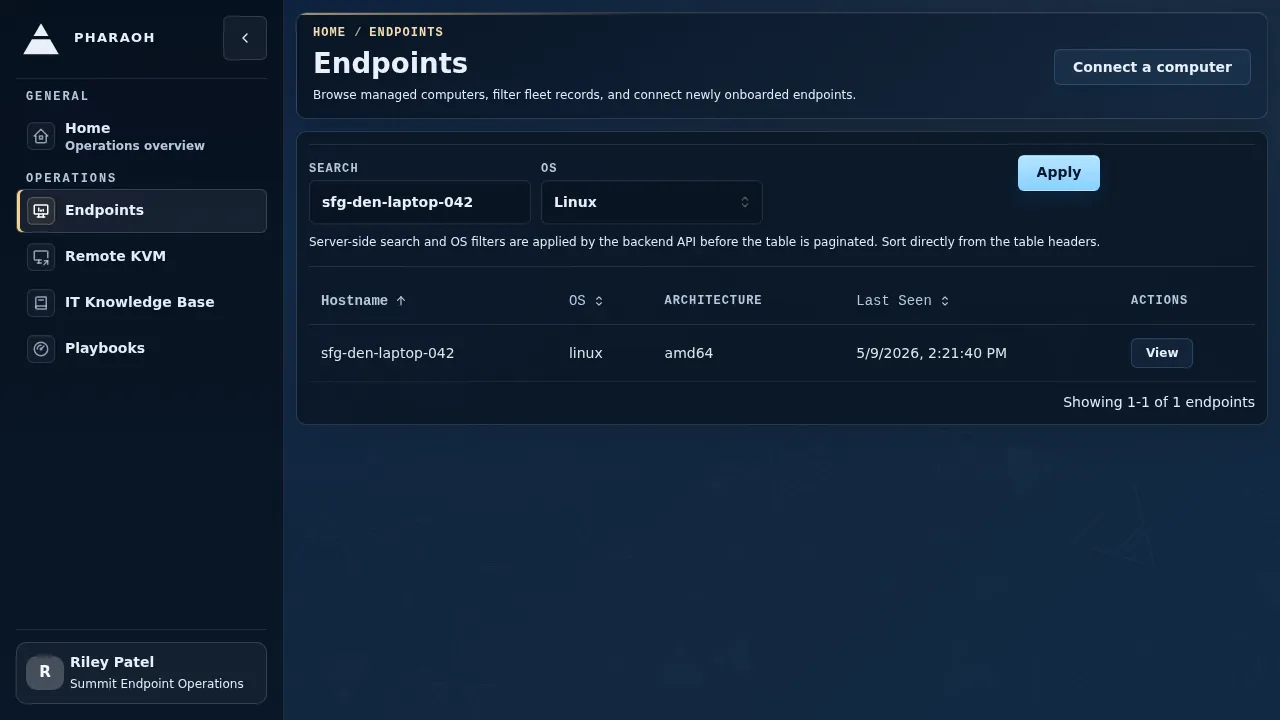
Step 1: Narrow The Endpoint List
Section titled “Step 1: Narrow The Endpoint List”Open Endpoints.
Use the controls in this order:
- Enter the most specific hostname or computer ID you know in
Search. - Choose an OS filter when the fleet is noisy.
- Select
Apply. - Sort by
Last Seenif several rows look similar.
The page applies filters before paginating the table, so the visible rows should already reflect the backend result set.
If no endpoint matches, clear filters and search by a broader identifier. If the endpoint still does not appear, switch to enrollment troubleshooting instead of starting an investigation from the wrong machine.
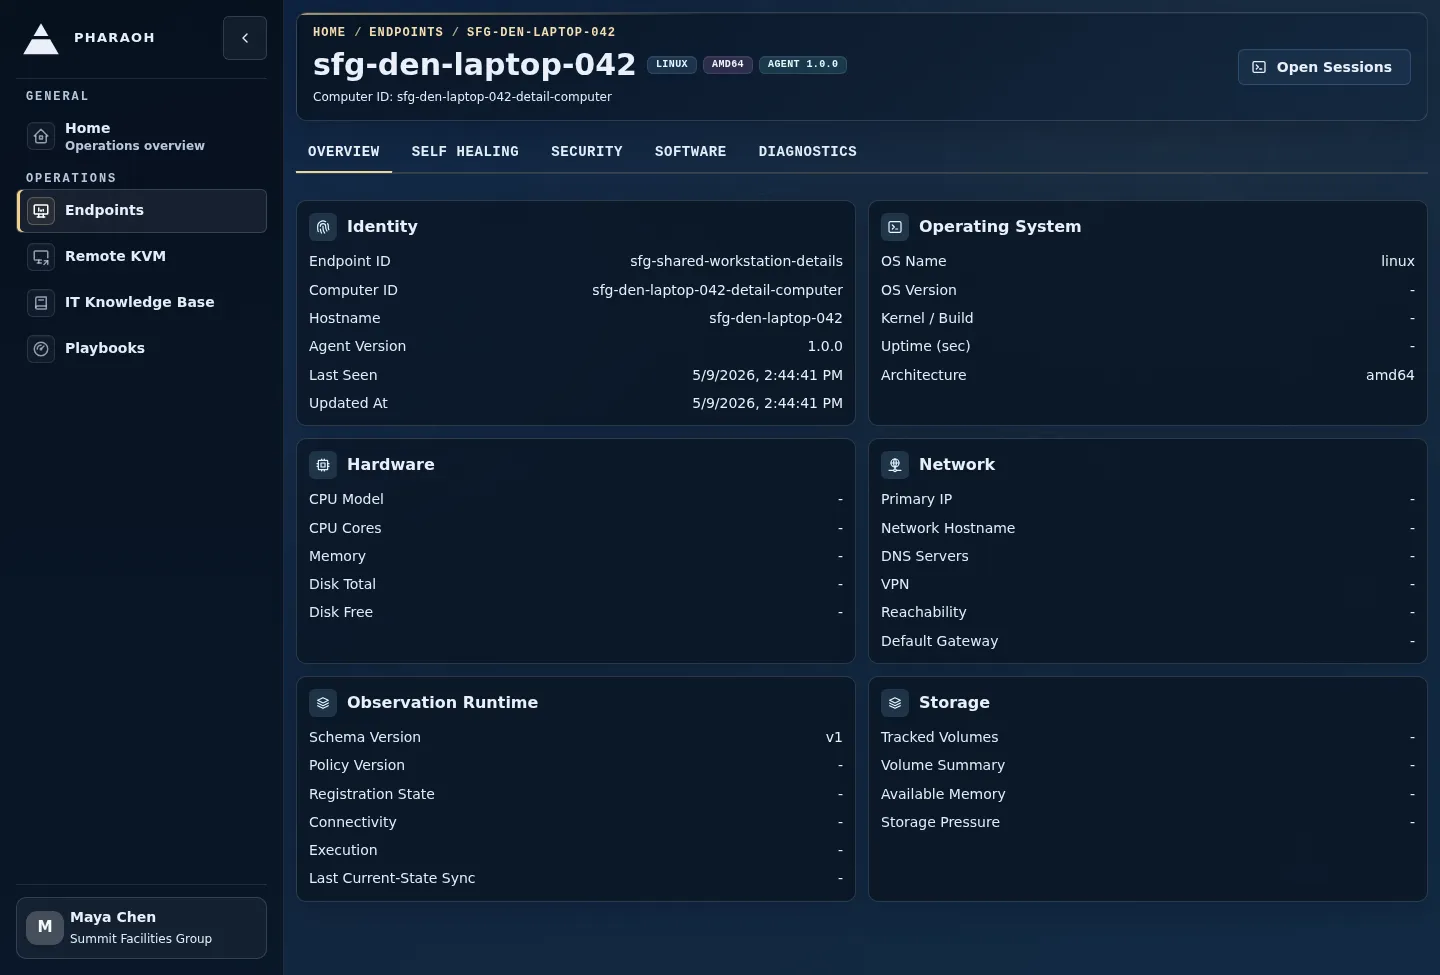
Step 2: Open The Endpoint Details Page
Section titled “Step 2: Open The Endpoint Details Page”Select View on the matching row.
Start with the header and identity summary:
- hostname
Computer ID- OS, architecture, and agent version badges
Last SeenOpen Sessions
If the hostname or computer ID does not match your incident context, go back to Endpoints and choose another row.
Step 3: Check Sentinel Context
Section titled “Step 3: Check Sentinel Context”Read the Sentinel panel before you move through the detail tabs.
Use it to answer:
- Is Sentinel configured for this endpoint?
- When did the last check run?
- Did it pass, fail, time out, or go stale?
- Are there pending escalations, knowledge entries, proposals, sessions, or threads?
Use Self-healing when the Sentinel status is part of the investigation. Use History when you need the endpoint self-healing page focused on prior Sentinel runs.
Step 4: Review Static Endpoint Details
Section titled “Step 4: Review Static Endpoint Details”Use the endpoint detail page before opening a live session:
Overviewfor identity, operating system, hardware, network, storage, observation runtime, security posture, and software inventory.Diagnosticsfor collection freshness, domain status, and collector errors.
Stop here if static details answer the question. For example, a stale Last Seen, missing collector data, or wrong architecture badge can be enough to route the incident without launching live work.
Step 5: Decide Whether Live Context Is Needed
Section titled “Step 5: Decide Whether Live Context Is Needed”Open a live session when the investigation needs active endpoint context:
- you need Pharaoh to inspect or explain a current condition
- you need fresh visual or transport evidence
- you need guarded commands or remediation
- you need an auditable session worklog
Stay on the details page when you only need inventory state, historical freshness, or Sentinel context.
Step 6: Hand Off To The Session Workspace
Section titled “Step 6: Hand Off To The Session Workspace”Select Open Sessions.
The endpoint session workspace adds the live investigation surface:
Agent worklogfor turn-grouped conversation and execution outputFollow-upfor the next operator promptLive endpoint intelligencefor the latest frame, evidence ledger, transport state, and policy posture- lifecycle controls such as
Stop active turnandClose session
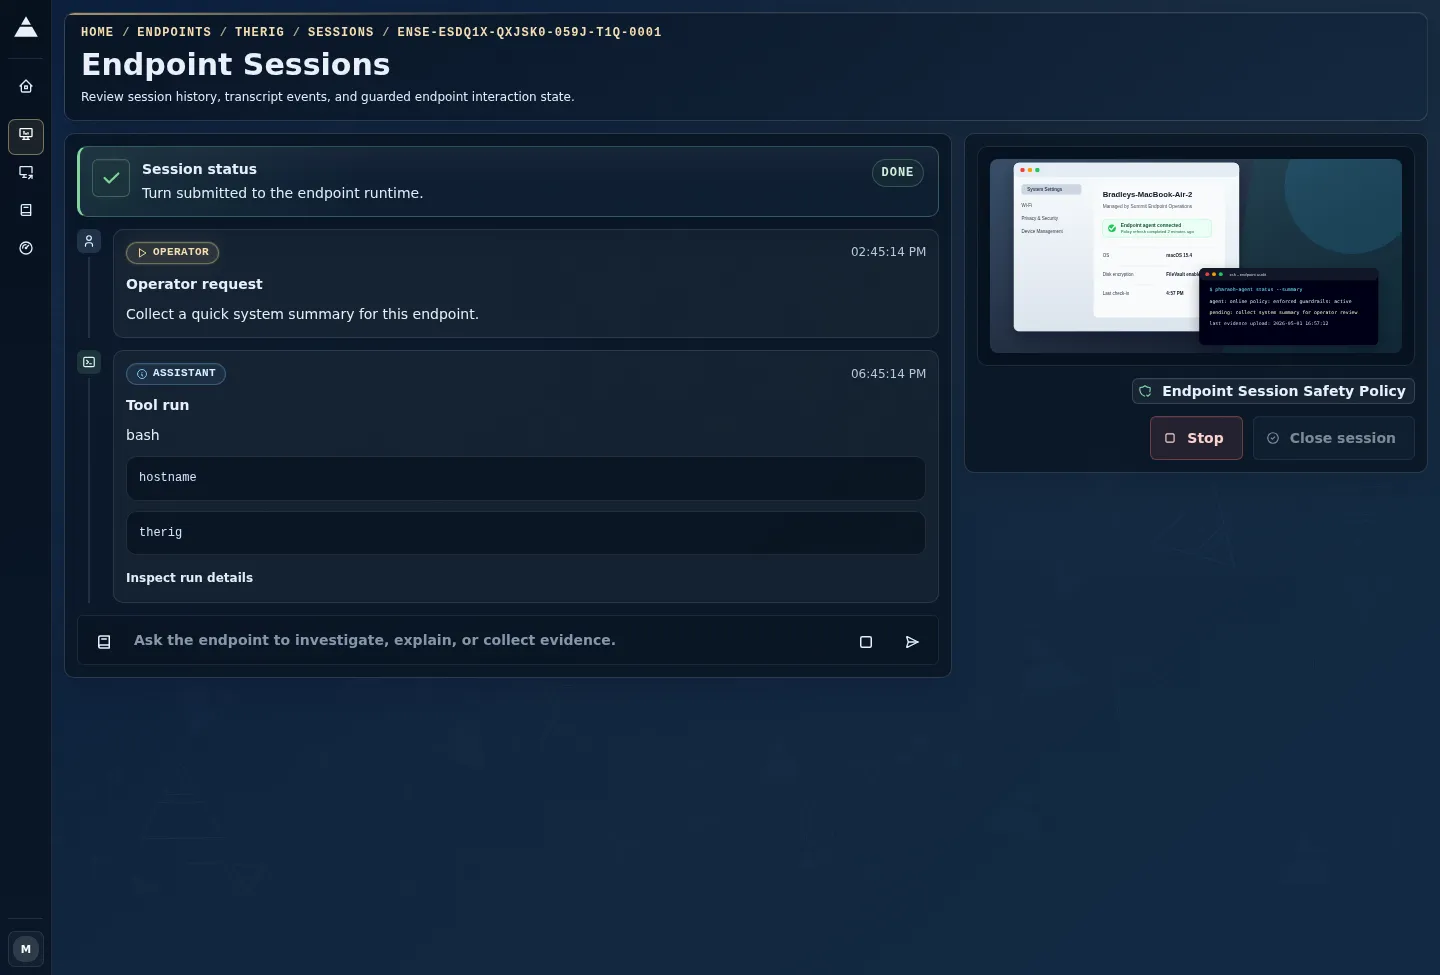
Before sending a prompt, compare the session state with the details page. If the details page looked stale and the workspace is still waiting for a frame, treat the live evidence as unavailable until Pharaoh reports fresh context.
Step 7: Capture The Investigation Outcome
Section titled “Step 7: Capture The Investigation Outcome”End the walkthrough by recording the result in plain operational terms:
- static endpoint details answered the question
- Sentinel or self-healing already owns the next action
- the endpoint appears stale or offline
- a live session is active and has fresh evidence
- a live session was attempted but transport or endpoint lookup failed
Close the session when live work is complete. Keep the session open only when another operator will continue from the same worklog.